econodata.ai
Canada and the United States

Evidence first.

In-depth, lightning-fast research you can trust.

What we do

Research

AI- and data-driven economic research and thought leadership.

Get in touch →

Consulting

Economic and corporate-finance advisory, policy and regulatory analysis, bespoke research and white papers, and financial-markets software.

Get in touch →
In development

Modelling

AI-assisted, data-rich economic models aimed at reliability.

Latest briefs
All briefs →
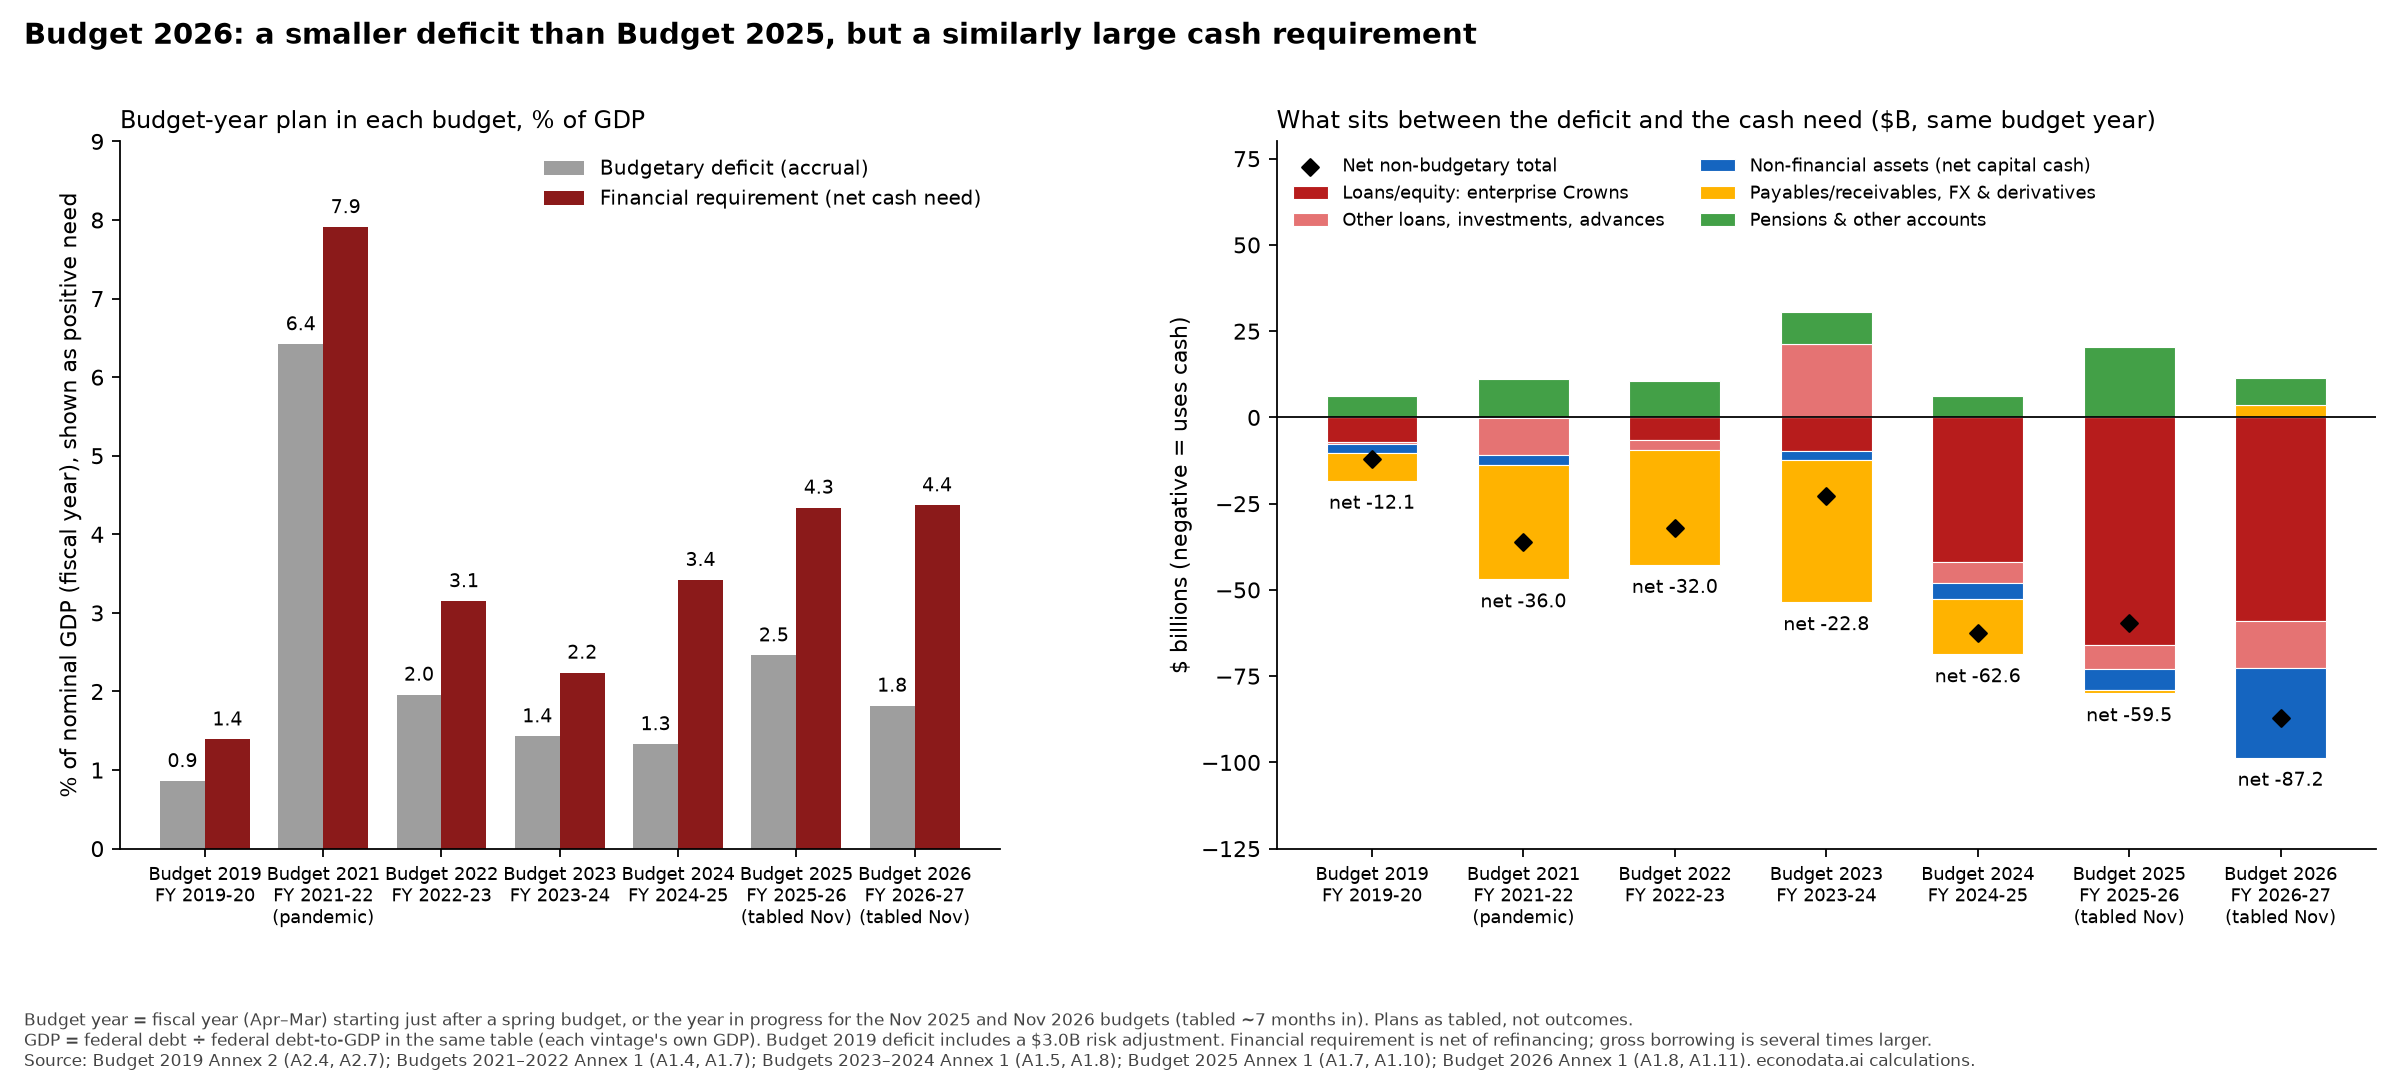
Budget 2026 cash requirement compared with earlier budgets
9 November 2026

Same cash need, different contents

Budget 2026’s financial requirement for 2026–27 is $149.5 billion, almost the same total as Budget 2025’s plan for that year, with more of the need in assets and loans.

Read the brief →
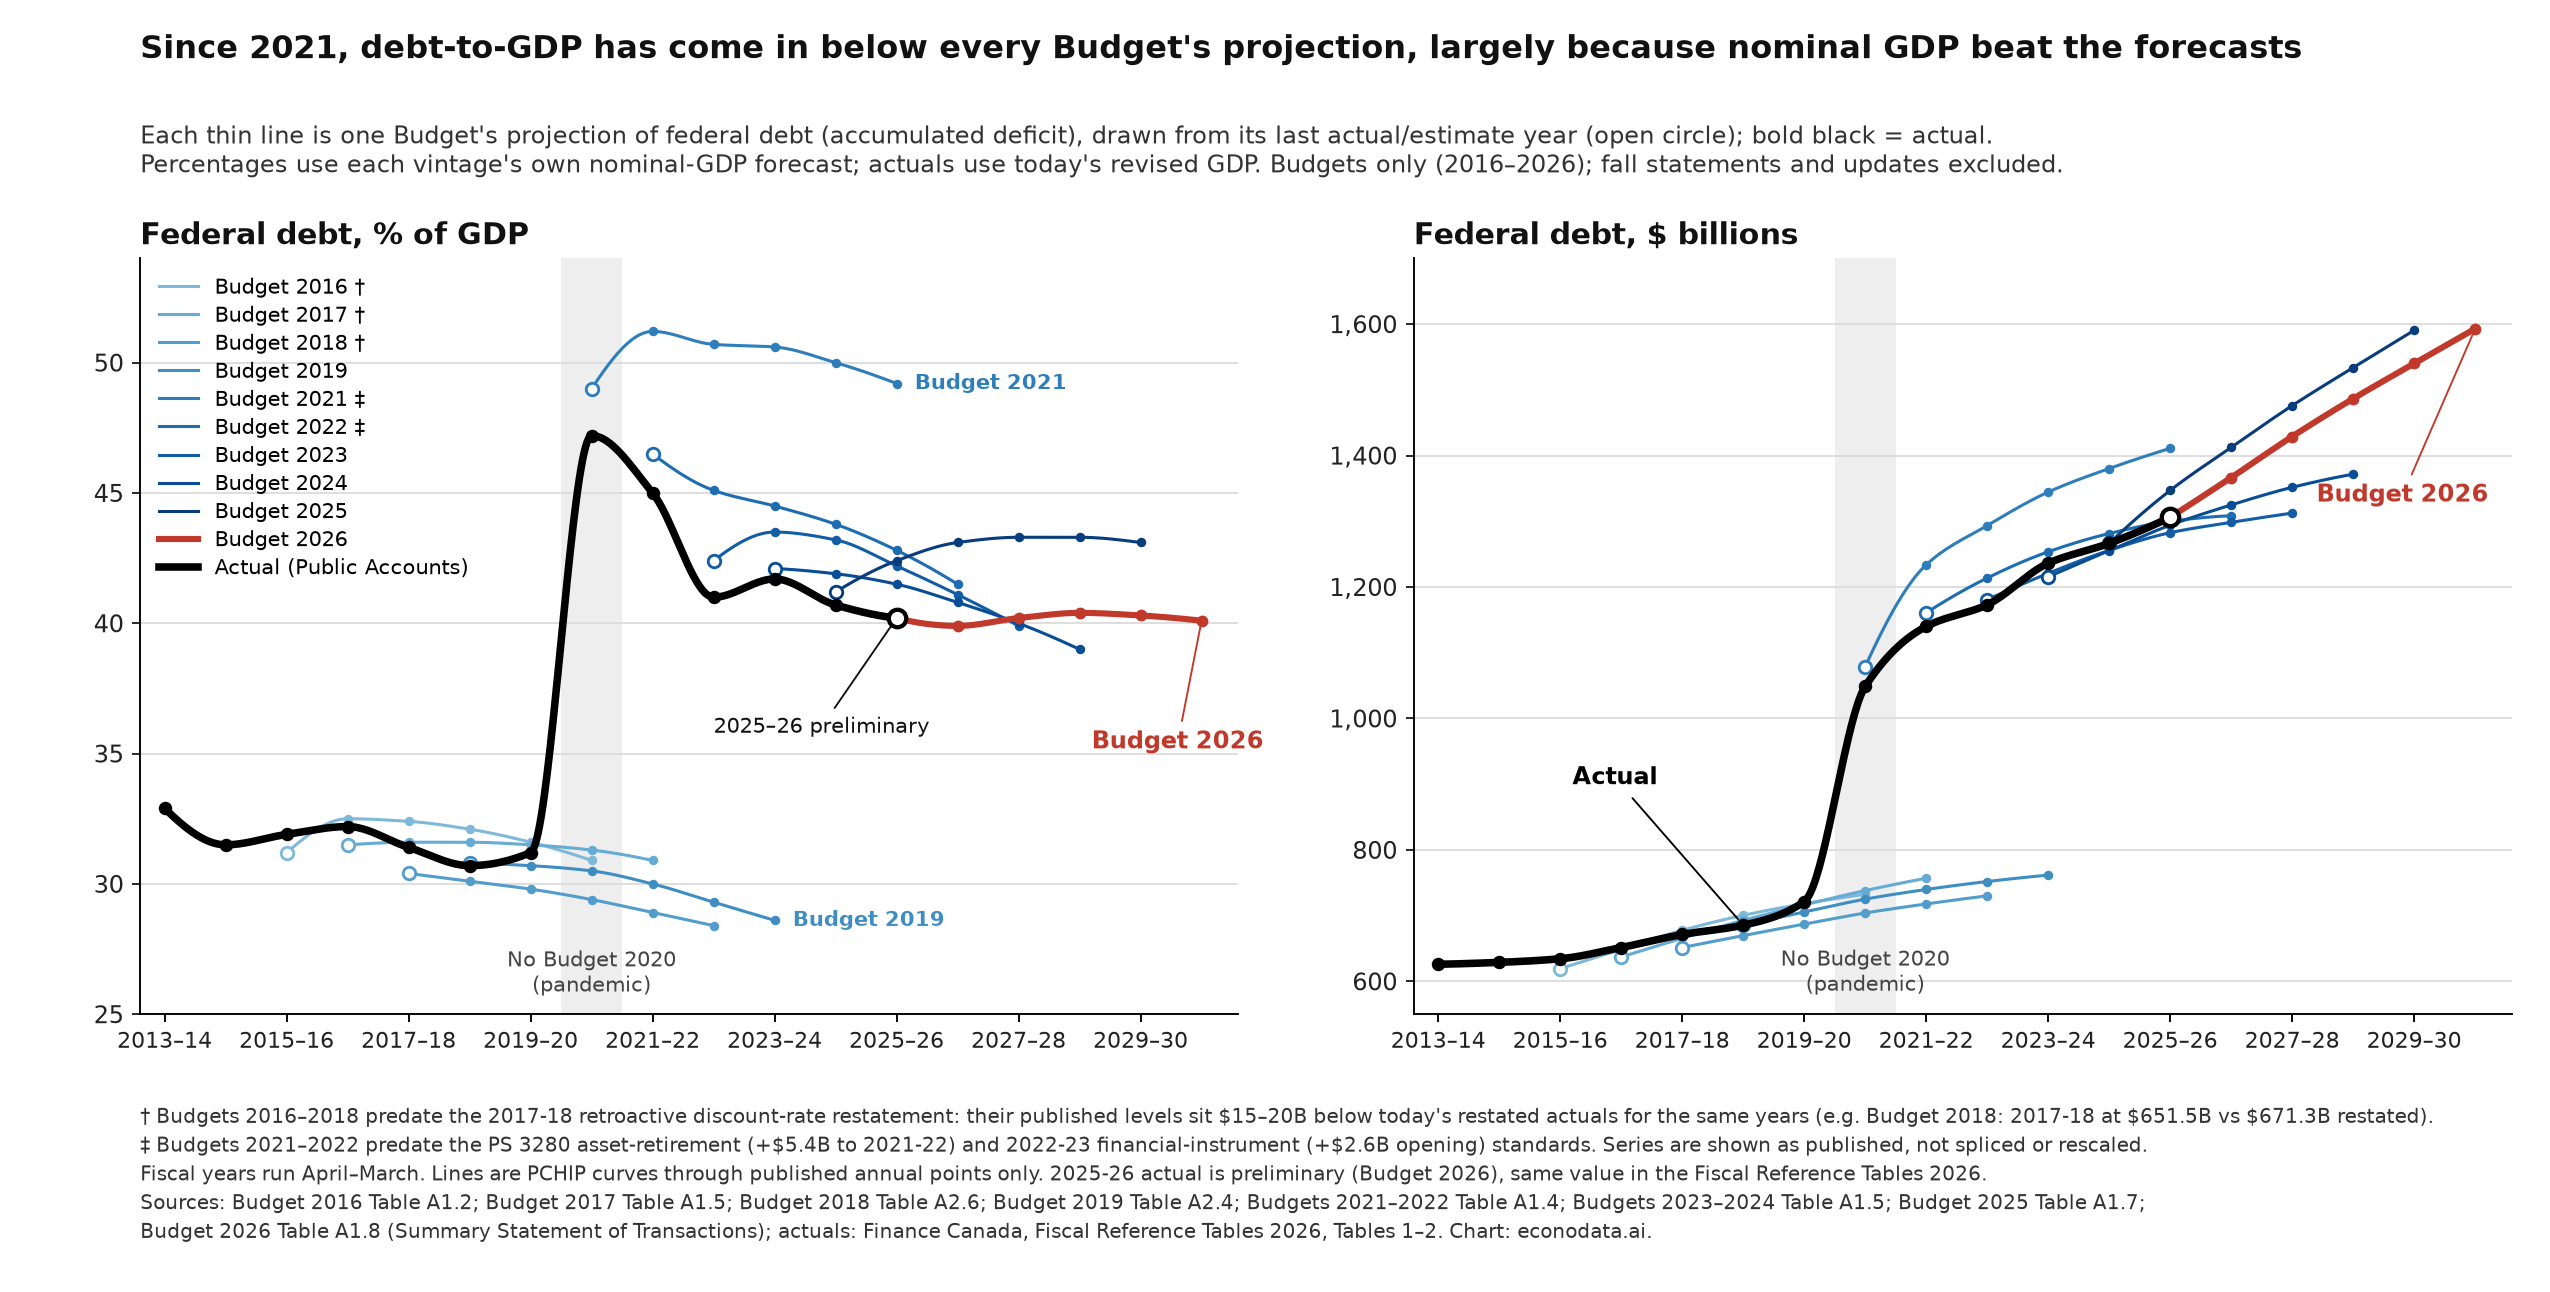
Federal debt-to-GDP projections by budget vintage versus actuals
9 November 2026

Do long-term debt-to-GDP projections even matter?

Since 2021, the federal debt-to-GDP ratio has come in below every Budget’s projection, largely because nominal GDP beat the forecasts.

Read the brief →
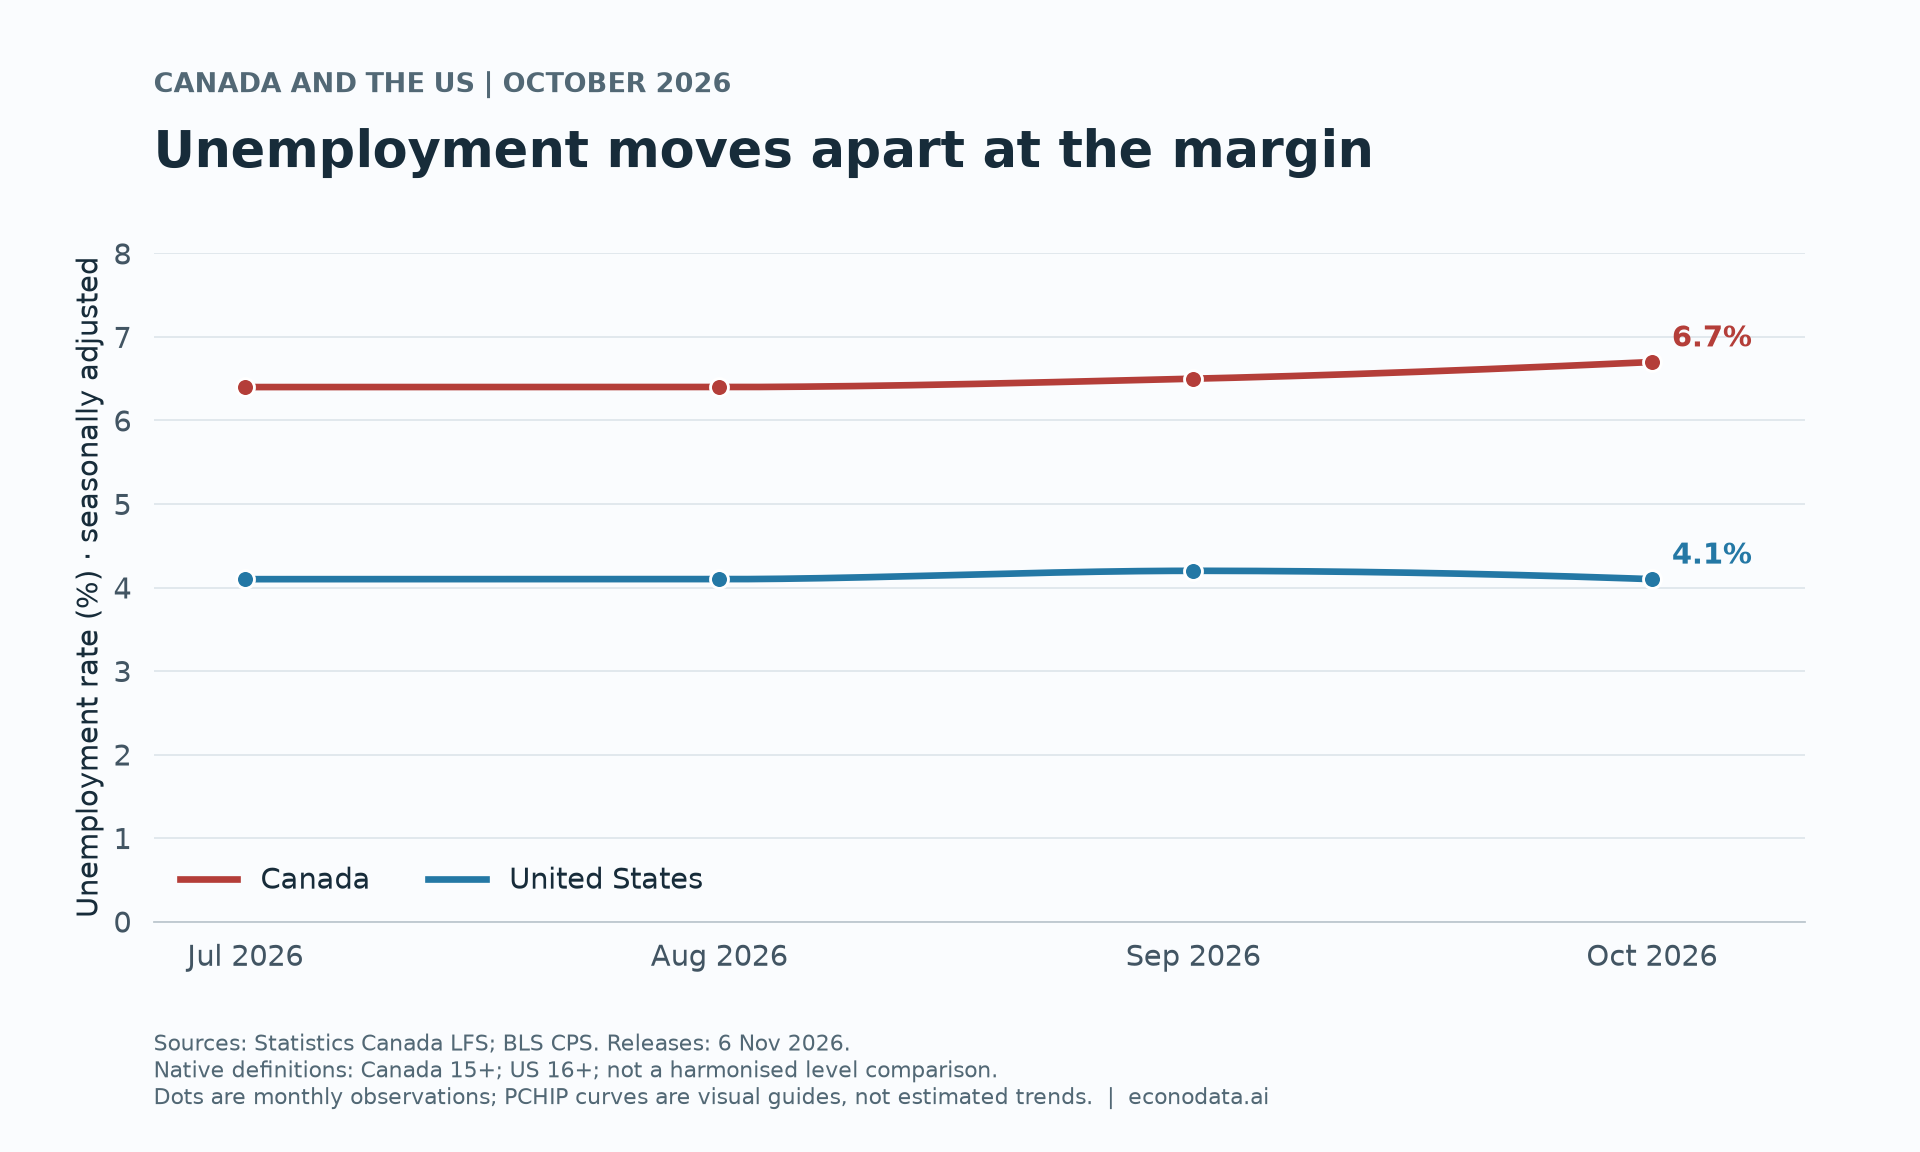
Canada and US unemployment rates, July to October 2026
6 November 2026

Canada is stalling; the US jobs rebound needs more than one month

Canada lost 4,700 employed people in October, and unemployment rose to 6.7%. The US added 165,000 payroll jobs; unemployment edged down to 4.1%.

Read the brief →
9 November 2026 · Budget 2026 deep dive
Since 2021, debt-to-GDP has come in below every Budget’s projection, largely because nominal GDP beat the forecasts

Each thin line is one Budget’s projection of federal debt (accumulated deficit), drawn from its last actual or estimate year (open circle). Bold black is the actual path. This is the percent-of-GDP panel of the published chart; the dollar panel is on the brief page.

† Budgets 2016–2018 predate the 2017-18 retroactive discount-rate restatement: their published levels sit $15–20B below today’s restated actuals for the same years (e.g. Budget 2018: 2017-18 at $651.5B vs $671.3B restated).

‡ Budgets 2021–2022 predate the PS 3280 asset-retirement (+$5.4B to 2021-22) and 2022-23 financial-instrument (+$2.6B opening) standards. Series are shown as published, not spliced or rescaled.

Fiscal years run April–March. Lines are monotone-x (PCHIP-like) curves through published annual points only. 2025-26 actual is preliminary (Budget 2026), same value in the Fiscal Reference Tables 2026. Sources are listed on the brief page. Chart: econodata.ai.

Each thin line is one Budget’s projection of federal debt (accumulated deficit). Bold black is the actual path. Post-pandemic projections of the ratio came in too high; a large part of that miss is nominal GDP coming in above the forecasts.